aUniversity of Oldenburg, Organic Chemistry I, D-26111 Oldenburg, Germany
bBASF Aktiengesellschaft, Farbenlaboratorium, D-67056 Ludwigshafen, Germany
ABSTRACT
The reflection-back-to-the-fiber SNOM under shear-force control with sharp and cold uncoated tips provides reliable submicroscopic resolution on rough surfaces without topographic artifacts. The high lateral resolution is the result of a sudden increase in reflectivity when the tip goes close to the surface at about 50 % vibration damping. This technique has been tested for samples of practical importance in the field of organic colourants and for Raman spectroscopy.
In the first example the radial distributions of different disperse dyes within polyester fibers have been studied. SNOM measurements on cross-sections of coloured fibers allow separating the fluorescence signal of the dyes out of the total internal reflection signal with appropriate filters. The fluorescence SNOM images allow to quantify the penetration (diffusion) of the dye into the fibers. Ring-dyed and uniformly dyed fibers can easily be distinguished. Local photobleaching of fluorescence is demonstrated. Topographic and optical images correspond precisely both in µm scale and in nm scale scans.
In the second example fluorescent nanoparticles (100 - 200 nm diameter) embedded in thin films of polyvidone were studied by SNOM and AFM. The optical images provide single spherical particles (of correct size) as well as larger aggregates. The emerging topographies are 10 nm wider than the fluorescence SNOM images which allows to estimate a 5 nm coverage of the resin.
In the third example local Raman SNOM spectra of scratched Si and its SiO2 cover, as well as of GaN were measured with an optoacoustic single photon counting spectrometer at 488 nm excitation in collection times of 10 min. Possible applications to biomaterials are discussed.
Keywords: Reflection SNOM, uncoated tips, submicroscopic resolution, fluorescence, local bleaching, microtome cuts, nanoparticles, aggregation, Raman SNOM spectroscopy, rough surfaces.
1. INTRODUCTION
Optical contrast at supermicroscopic resolution (15 - 20 nm) will be essential as a routine method for biological and biomedical materials. Such materials are soft, sensitive and of some roughness. Therefore, hot1 and blunt2 metal-coated tips, that are used in common aperture SNOM, are unsuitable. Sharp and cold uncoated tips are required instead. Their use for the detection of highly resolved chemical contrast has been demonstrated in a commercial Courjon-type3 arrangement on various organic surfaces,2,4-8 the wealth of applications discussed.2,8 High sensitivity is obtained by cross-polarized detection techniques.9 Reflection-back-to-the-fiber SNOM at constant distance has major advantages when compared to transmission SNOM (often in constant height mode) because it avoids interference and far-field effects. The sudden near-field enhancement of reflected light is an easily detected prerequisite for valid SNOM that has been stressed again recently.5,6 Thus, SNOM on corrugated surfaces can be measured without topographic artifacts and without destruction of soft materials. The SNOM contrast includes absorption, fluorescence, Rayleigh, Raman, polarization, and specific shear-force response influences.
2.1 THE APPARATUS
A commercial reflection-back-to-the-fiber SNOM has been used (RASTERSCOPE 4000 SNOM, DME, Copenhagen) with 10 and 90 µm piezo heads in cross-polarized detection mode and shear-force distance control under ambient conditions using the 488 nm emission of an Ar-ion laser.2,4-8 The working point was set close to 50 % damping of the tip-vibration and then optimized for best image quality. The tip radius was 15 - 20 nm as determined with SEM by choosing sample tips under constant pulling conditions of a Sutter Instrument Model P-2000 Quartz Micropipette Puller using a CO2-laser. The tips must be as sharp as possible. Etched tips (40% HF and immiscible organic solvent) are not sharp enough and tend to break very readily upon scanning. Both mono- and multimode tips for 488 nm with core diameters of 3.4 ± 1 or 5.7 ± 1 µm and 125 µm step index coating at lengths of 60 - 100 cm were used. They were not designed to retain polarisation and produced an illuminated spot with typically 1 µm diameter. The background was reduced by two perpendicular Glan-Thompson polarizers. Intensities in the forward and backward directions were typically 3 mW and 0.1 - 0.5 µW. The scanning speed was typically 200 µm/s at 50 µm and 30 µm/s at < 10 µm scans. Simultaneous images of topography and optical properties were recorded with subwavelength resolution. Lateral dithering of the fiber probe near its resonance frequency (100 - 400 kHz) was at a right angle to the scan direction at amplitudes of 5 - 10 nm. The rectified a.c. part of the shear-force signal was used as a feedback signal to keep the tip-surface distance constant (notwithstanding specific shear-force responses of different materials that become part of the optical signal) and as a record of the surface topography. Sharp and broken or abrased tips are easily sorted out by recording the near-field intensity enhancement that is only observed with good tips.5,6
An optoacoustic spectrometer with single-photon counting of IFU, Flöha, Germany, was used for the near-field Raman measurements. Five points averaging was applied for the smoothening of the spectra.
2.2 THE SAMPLES
The coloured textile fibers were achieved by a high temperature exhaust dyeing procedure (at 115°C or 130°C, 30 min) of undyed polyester fabrics with three disperse dyes. The disperse dyes used are listed in Figure 1.
|
1 |
2 |
|
3 |
The cross-sections of the polyester fibers were made by embedding the coloured textile fibers into the appropriate resins Technovit 7100 (Heraeus Kulzer GmbH, Wehrheim) or Agar 100 (Plannet GmbH, Wetzlar) and cutting them with a microtome.
The sample with fluorescent nanoparticles was prepared by incorporating an aqueous dispersion of the fluorescent spherical nanoparticles (gift of Dr. Böhm, BASF AG Ludwigshafen, Farbenlaboratorium) into the aqueous solution of polyvidone, spreading a drop of resulting mixture over a glass slide using a rake and drying the film in air at room temperature.
For the Raman measurements a silicon waver was scratched 2.5 µm wide in the (001) surface with a diamond pencil. The thickness of SiO2 layers on Si was determined by ellipsometry. Raman-SNOM was measured 5 h later under shear-force control at a preselected spot in the middle of the scratch that had freshly grown SiO2 on it.
The GaN sample was grown to 12.6 µm thickness by MBE (molecular beam epitaxy) on (0001) of a 500 µm sapphire plate.
Fluorescence technique in microscopy is a basic microscopical technique. On illuminating the sample with a laser or a narrow band light source the sample is studied via the fluorescence image. This can easily be achieved by separating the totally reflected light with the help of edge filters or bandpass filters which reject the exciting light and only transmit the fluorescence shifted to longer wavelengths. The fluorescence image depicts the distribution of fluorescing molecules within the sample.
Fluorescence microscopy is especially prominent and widespread in studying biological and biomedical systems. Selective staining with a variety of fluorescence labels allows to visualize individual compartiments of cells etc.
In this work the fluorescence technique is used in near-field microscopy to overcome the diffraction-limit in nanoparticles and to make use of the particular near-field response to microscopic samples in the 10 µm range. Some applications in technical fields are presented.
3.1 FLUORESCENCE SNOM OF COLOURED TEXTILE FIBERS
The cross-sections of polyester fibers coloured with dyes 1, 2, 3 were investigated with the SNOM apparatus using uncoated tips. For excitation the 488 nm line is used; the fluorescence is selected with an edge filter OG 515 (Schott, Germany) in each case.
Fibers coloured with dye 1:
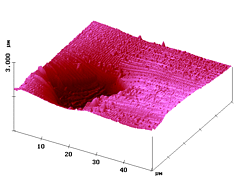
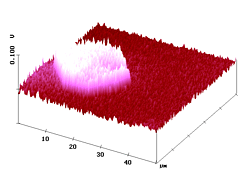
Figure 2 (left) shows a large-scale scan in shear-force AFM mode which depicts the topography. As expected, the microtome cut was not flat over the whole area; the fluorescent fiber snapped back into the resin during the microtome cutting (due to different elasticities of the materials) and lies deeper by about 1 µm. The slopes consist of resin and so does the upper plane.


Figure 2. Left: shear-force AFM topography of a microtome cut of a polyester fiber that is evenly coloured with the fluorescent dye 1 and embedded in Technovit 7100 resin; right: simultaneous fluorescence SNOM (488 nm) as detected through a multimode fiber-tip and a cutoff filter transmitting from 506 nm (1 %) onward. The simultaneous optical image (Figure 2, right) shows that the signal comes exclusively from the bottom of the topography, i.e. the fluorescence is really restricted to the fiber area. In the present case, the fluorescence is homogeneously distributed over the whole fiber cross-section.
A VRML-Plugin is required to view these Images (e.g. Cosmo-Player) !
VRML Image of Fig 2a (low resolution- approx 54 kB)
VRML Image of Fig 2b (low resolution - approx. 69 kB)
It is demonstrated that the optical image is not influenced by the very strong topography whatsoever and the fluorescence light is collected in the near-field gap of about 5 nm between tip and sample surface.
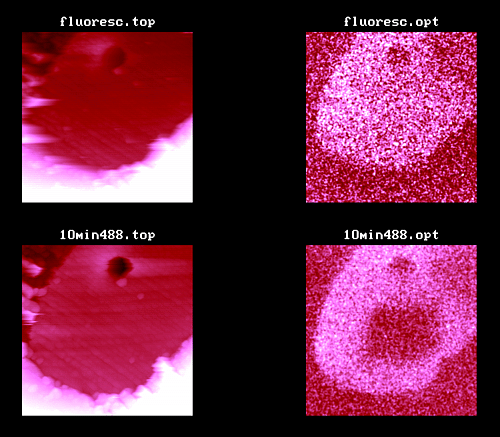
Figure 3. AFM and fluorescence SNOM of a microtome cut of a fluorescent polyester fiber (dye 2) in soft Technovit 7100 resin (the non-fluorescent depression 3 µm wide and 800 nm deep remained unexplored); top: topography and fluorescence SNOM of a 25 µm scan (scan rate 150 µm/s); bottom: a 20 µm scan (scan rate 60 µm/s) after 10 min scanning in a 5 x 5 µm2 area with the uncoated illuminated tip (0.8 kW/cm2) giving a 6 x 6 µm2 area of photobleaching in the optical image.
Fibers coloured with dye 2:
The top pair in Figure 3 shows that the dyes' fluorescence is homogeneously distributed over the fiber cross-section.
An important topic is photobleaching of fluorescent dyes. It can easily be studied by scanning for extended times in fluorescent areas. Figure 3 (bottom) shows simultaneous images of the same sample after illumination of a 5 x 5 µm2 area for 10 min by scanning with the uncoated tip. The dark square in the optical image proves that local fluorescence bleaching has occurred. Purposeful local fluorescence bleaching (shear-force control without scanning) would create "holes" of about 1 µm diameter with uncoated tips, but far-field apertured tips10 would provide considerably smaller spots.
Figure 4 demonstrates the measurement of diffusion profiles within fibers. The shape of the fiber is seen in the topographic image, the distribution of the dye 2 (after 30 min heat transfer at 115°C) judged from the cross-section of the fluorescence SNOM intensity. The curve starts at the fiber surface and declines exponentially toward the fiber axis. Photobleaching does not seriously interfere.
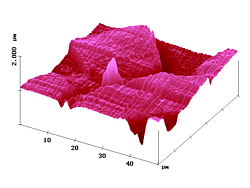
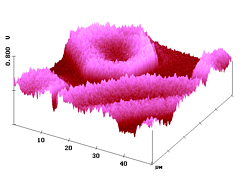

Figure 4. 50 µm AFM and fluorescence SNOM scan of a microtome cut of polyester fibers with dye 2. Z-scale in topography: 2 µm.
A VRML-Plugin is required to view these Images (e.g. Cosmo-Player) !
VRML Image of Fig 4a (low resolution- approx 54 kB)
VRML Image of Fig 4b (low resolution- approx 54 kB)
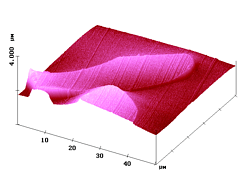
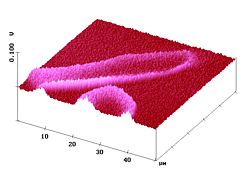
Figure 5. 50 µm AFM and fluorescence SNOM scan of a microtome cut of polyester fibers with dye 3. Z-scale in topography: 1 µm.
A VRML-Plugin is required to view these Images (e.g. Cosmo-Player) !
VRML Image of Fig 5a (low resolution- approx 54 kB)
VRML Image of Fig 5b (low resolution- approx 54 kB)
VRML Image of Fig 5c (low resolution- approx 54 kB)
VRML Image of Fig 5d (low resolution- approx 54 kB)
Fibers coloured with dye 3:
Figure 5 shows AFM and fluorescence SNOM images of cryo microtome cuts that go skewed through the dyed textile fibers. Clearly, the fluorescence intensity is highest near the fiber boundaries and declines on going inside the fiber; i.e. this sample represents a ring-dyeing.
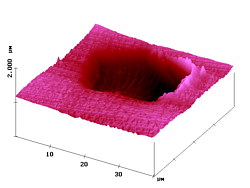
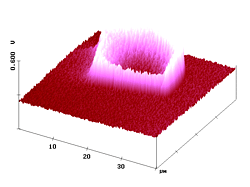

Figure 6. 40µm AFM and fluorescence SNOM scan of a microtome cut of a polyester fiber dyed by heat transfer techniques with dye 3 at moderate penetration depth. Z-scale in topography: 1 µm.
A VRML-Plugin is required to view these Images (e.g. Cosmo-Player) !
VRML Image of Fig 6a (low resolution- approx 54 kB)
VRML Image of Fig 6b (low resolution- approx 54 kB)
Thus, in the image "snom2" the fluorescence contrast is not disturbed by the skew orientation of the textile fiber or the cutting traces or the non-fluorescent topographic features and that confirms the validity of the constant distance SNOM technique.
The near-field fluorescence cross-section in Figure 6 shows the diffusion profile belonging to fibers coloured with dye 3. It indicates a weak penetration of the dye (after 30 min heat transfer at 130°C), . Again an exponential decline toward the fiber axis is detected.
Heat transfer techniques in dyeing can be used to control the penetration depths of dyes into the PET fibers. The speed of diffusion into the polymer depends on temperature, time of heat exposure and dye structure. Thus, intensity profiles of near-field fluorescence may help to quantify diffusion processes on µm scale.
Interestingly, the profiles of the near-field fluorescence intensity in the Figures 4 and 6 can be fitted to Fick's second law of diffusion, which is numerically solved by using the tabulated values of the "error function" in the usual way. The resulting D-values have been constant over the complete curves (right curves in Figures 4 and 6); this indicates that the near-field fluorescence intensities are proportional to the local dye concentrations. Furthermore, the absolute values obtained for the diffusion coefficients (2: D115°C = 4.7 x 10⁻¹¹ cm2/s ; 3: D130°C = 2.4 x 10⁻¹¹ cm2/s) are consistent with similar values in the literature.11
Thus SNOM is a hitherto unexplored device for direct determination of diffusion coefficients of fluorescent molecules in polymers. It does not matter if the (not perfectly vertical) fiber is above (Figure 4) or below (Figure 6) the surface. We prefer to choose the steepest decline (least abnormalities in the diffusion) and should use cryo microtome cuts for even higher precision when the activation energies for the diffusion is to be determined by the SNOM technique.
These results demonstrate, that the SNOM technique can be extended to large microscopic features and that it is useful for the determination of diffusion coefficients over distances of about 10 µm. Applications to the dyeing techniques in the microscopy of biological objects are clearly envisaged.
3.2. NEAR FIELD FLUORESCENCE OF NANOPARTICLES
With the present SNOM technique lateral optical resolution of 15 - 20 nm on organic surfaces has been demonstrated. 7 Figure 7 shows shear-force AFM and fluorescence SNOM pictures of a sample where submicroscopic fluorescing particles (diameters of 100 - 200 nm) are embedded in polyvidone resin of 1 µm thickness on glass. Both images show that the pigment particles are largely present as aggregates under these conditions, but non-aggregated single particles are still found. The simultaneous images in Figure 7 are very similar. Clearly, the sites of topography correspond to the sites of near-field fluorescence. The single particles and the aggregates emerge over the surface by up to 69 nm (Rms = 15.3 nm). The single particles have half-widths of 110 - 210 nm in the AFM and 100 - 200 nm in the SNOM image. It is thus clear: the polyvidone cover on the surface particles is about 5 nm thick. The optical image gives the correct size (lower and higher limit) of the particles and thus confirms again the high resolving power of our SNOM with very sharp uncoated tips (radius 15 - 20 nm; the near-field enhancement factor5,6 was 4.7 - 4.8 in these experiments). Due to the resin cover, the submicroscopic fluorescence features are indeed smaller than the topographic features!
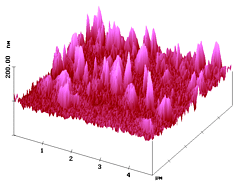
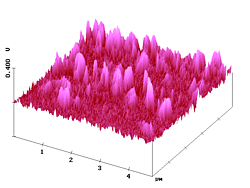
Figure 7. AFM (left) and simultaneous SNOM (right) of aggregated and non-aggregated dye nanoparticles with 100 - 200 nm diameter that are embedded in polyvidone resin.
A VRML-Plugin is required to view these Images (e.g. Cosmo-Player) !
VRML Image of Fig 7a (low resolution- approx 54 kB)
VRML Image of Fig 7b (low resolution- approx 54 kB)
The larger features in Figure 7 correspond to the aggregates, and a closer comparison of the AFM and fluorescence SNOM images reveals three types of aggregation: linear, angular, and dense. We see extended, looped, and compact objects that are frequently more structured in the SNOM image. The angular aggregation is easily seen in the higher resolved images of Figure 8.
As the nanoparticles form a loop, the resin cover fills the void and closes the topographic object. Only SNOM differentiates between the different chemical species. Such information is of major importance for technical applications of nanoparticles and all different kinds of rough surfaces. These may be neat or covered by polymers like polyvidone.
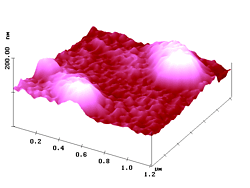
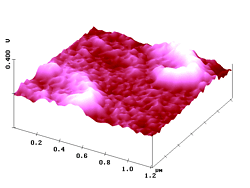
Figure 8. AFM (left) and simultaneous SNOM (right) of two looped aggregates of fluorescent nanoparticles (up to 69 nm high) and a single particle (with an atypically low emergence of 40 nm) in a polyvidone resin.
A VRML-Plugin is required to view these Images (e.g. Cosmo-Player) !
VRML Image of Fig 8a (low resolution- approx 54 kB)
VRML Image of Fig 8b (low resolution- approx 54 kB)
Local spectroscopy in the nm region will be essential for analyses of biomaterials and all kinds of rough technical surfaces. It requires the combination of the fiber SNOM with a highly sensitive spectrometer, if local fluorescence or Raman spectra are to be recorded. Recently Raman spectra of 154 x 190 nm2 areas of Si have been reported when using metal-coated apertured (150 nm) tips.12 However, we were intrigued by the absence of the 500 cm-1 emission of the SiO2 cover in that report,12 because non-resonant Raman spectroscopy should also be possible in a near-field. We were able to resolve the 519.7 cm-1 peak of Si and also the emission of the ca. 5 nm thick SiO2 layer on it at 500 cm-1 with our shear-force constant distance technique.6 It was only necessary to collect 100 spectra (1 s integration time per point) and to subtract the Raman emission of the fiber-tip material.5,6 The total collection time was 10 min. Unlike the claim of Ref.12 whereupon scratched Si did not emit its characteristic Raman peak due to stress (the sample was for > 9 h in the air), we did observe the 519.7 cm-1 Si peak and also the peak at 500 cm-1 of the freshly grown SiO2 cover 5 h after the scratching (Figure 9, left). Local Raman SNOM was performed in the middle of the 2.5 µm wide groove. Furthermore we resolved (10 min collection time) the E1(TO) and E2 Raman modes at 560.8 and 570.4 cm-1 of GaN13 (Figure 9, right). The (0001)-face was studied locally in an uncontaminated area with 488 nm light that is not absorbed by GaN. Even sharper spectra will be obtained by increasing the number of points and the collection time. Local Raman SNOM records only in the minute near-field area covered by the vibrating tip with 15 - 20 nm radius. Submicroscopic impurity areas have been detected in these experiments and will be elucidated by local Raman spectroscopy. Thus, we attained a major advance towards non-resonant local Raman spectroscopy of rough technical surfaces.


Figure 9. Local Raman spectrum of (top) scratched Si and the freshly grown SiO2 on it 5 h after scratching a 2.5 µm wide groove, and of (bottom) GaN (0001) on Al2O3. The Raman signal of the fiber was subtracted from the near-field spectra after smoothening.
The results presented in Chapter 3 demonstrate that the SNOM technique with sharp uncoated tips can be successfully applied to submicroscopic nanoparticles and extended to large microscopic features. The absence of topographic artifacts has been demonstrated as well as local photobleaching. Furthermore the first determination of diffusion coefficients with SNOM has been achieved over distances of about 10 µm.
It was possible to collect the fluorescence of dyes and the Raman scattering of semiconductors (Chapter 4) in the near-field under the conditions of the enhanced reflectivity. The separation from the rest of the SNOM contrast was attained by a cuttoff filter or by a spectrometer. A polyvidone cover of 5 nm thickness did not prevent the submicroscopic imaging of 100 nm wide particles at the correct size in the near-field fluorescence.
These important applications of SNOM are not restricted to dyeing technology and surface analysis of semiconductors but also for biological systems both above and below the diffraction limit. Improvements in resolution and the study of large scale near-field interactions by non-destructive SNOM are highly desirable and the reported techniques should be applicable to biological and biomedicinal materials.
We thank Dr. G. Seybold and Dr. A. Böhm (both BASF Aktiengesellschaft, Farbenlaboratorium, Ludwigshafen), for support and a gift of nanoparticles, and Dr. W. Müller, University of Oldenburg, for the GaN sample. T. Wallendorf and S. Marke, IFU GmbH, Flöha, are thanked for adjusting their optoacoustic spectrometer, for the Raman measurements at our SNOM device, for the data treatment, and for the ellipsometric measurements. DME, Copenhagen, is thanked for providing very sharp fiber tips.
1. A. H. La Rosa, D. I Yakobson, H. D. Hallen, Appl. Phys. Lett. 1995, 67, 2597.
2. G. Kaupp, Chemie unserer Zeit 1997, 31, 129-139; English translation in http://kaupp.chemie.uni-oldenburg.de/
3. M. Spajer, D. Courjon, K. Sarayeddine, A. Jalocha, J.-M. Vigoureux, J. Phys. (Paris) Ser. III 1991, 1, 1.
4. G. Kaupp, A. Herrmann, M. Haak, J. Vac. Sci. Technol. B 1997, 15, 1521.
5. G. Kaupp, A. Herrmann, SNOM by Near-Field Reflectance Enhancement: A Versatile and Valid Technique, J. Phys. Org. Chem. 1999, 12, in press.
6. G. Kaupp, A. Herrmann, M. Haak, SNOM, a genuine photochemical technique, Internet Photochem. Photobiol, 1998, http://www.photobiology.com/IUPAC98/page2.htm
7. G. Kaupp, A. Herrmann, J. Phys. Org. Chem. 1997, 10, 675.
8. G. Kaupp, in Comprehensive Supramolecular Chemistry, Vol. 8, 381 - 423 + 21 colour plates, ed. J. E. D. Davies, Elsevier, Oxford, 1996.
9. S. I. Bozhevolnyi, M. Xiao, O. Keller, Appl. Optics 1994, 33, 876
10. G. Kaupp, A. Herrmann, Ultramicroscopy 1998, 71, 383.
11. C. M. Brennan, J. F. Bullock, in Advances in Color Chemistry Series, Vol. 4, 44 - 82, ed. A. T. Peters and H. S. Freeman, Blackie Academic Professional, Chapman and Hall, Glasgow, 1996.
12. S. Webster, D. N. Batchelder, D. A. Smith, Appl. Phys. Lett. 1998, 72, 1478.
13. I.-H. Lee, I.-H. Choi, C.-R. Lee, E.-j. Shin, D. Kim, S. K. Noh, S.-J. Son, K. Y. Lim, H. J. Lee, J. Appl. Phys. 1998, 83, 5787.